Docker Compose 部署 Grafana + Prometheus + Node Exporter
Grafana 是一款开源的数据可视化与监控平台,可借助灵活的仪表板展示来自 Prometheus、InfluxDB、Elasticsearch、Graphite 等多种数据源的指标。本教程演示如何使用 Docker Compose 快速部署 Grafana、Prometheus 与 Node Exporter,实现主机监控与数据可视化。
1. 创建 docker-compose.yml
yaml
version: '3.8'

networks:
  monitoring:
    driver: bridge

services:
  node-exporter:
    image: prom/node-exporter:latest
    container_name: node-exporter
    restart: unless-stopped
    user: root
    volumes:
      - /proc:/host/proc:ro
      - /sys:/host/sys:ro
      - /:/rootfs:ro
    command:
      - '--path.procfs=/host/proc'
      - '--path.rootfs=/rootfs'
      - '--path.sysfs=/host/sys'
      - '--collector.filesystem.mount-points-exclude=^/(sys|proc|dev|host|etc)($$|/)'
    network_mode: host

  prometheus:
    image: prom/prometheus:latest
    container_name: prometheus
    restart: unless-stopped
    user: root
    volumes:
      - /opt/docker/grafana/prometheus.yml:/etc/prometheus/prometheus.yml    # ← 可自定义映射路径
      - /opt/docker/grafana/prometheus_data:/prometheus                      # ← 可自定义数据目录
    command:
      - '--config.file=/etc/prometheus/prometheus.yml'
      - '--storage.tsdb.path=/prometheus'
      - '--web.console.libraries=/etc/prometheus/console_libraries'
      - '--web.console.templates=/etc/prometheus/consoles'
      - '--web.enable-lifecycle'
    ports:
      - 9095:9090                                                            # ← 可自定义映射端口
    networks:
      - monitoring

  grafana:
    image: grafana/grafana
    container_name: grafana
    restart: unless-stopped
    user: root
    ports:
      - 3005:3000                                                            # ← 可自定义映射端口
    volumes:
      - /opt/docker/grafana/grafana:/var/lib/grafana                         # ← 可自定义数据目录
    depends_on:
      - prometheus
    networks:
      - monitoring
node-exporter的挂载建议保持默认;prometheus、grafana的映射路径与端口可按需调整。
2. 创建 prometheus.yml
yaml
global:
  scrape_interval: 15s

scrape_configs:
  - job_name: 'prometheus'
    scrape_interval: 15s
    static_configs:
      - targets: ['192.168.5.10:9095']

  - job_name: 'node'
    static_configs:
      - targets: ['192.168.5.10:9100']
将 IP 地址替换为你自己的主机地址。
3. 准备配置目录
创建用于存放配置与数据的目录(示例:/opt/docker/grafana),并放置上述两个配置文件。目录结构参考:
/opt/docker/grafana/
├── docker-compose.yml
└── prometheus.yml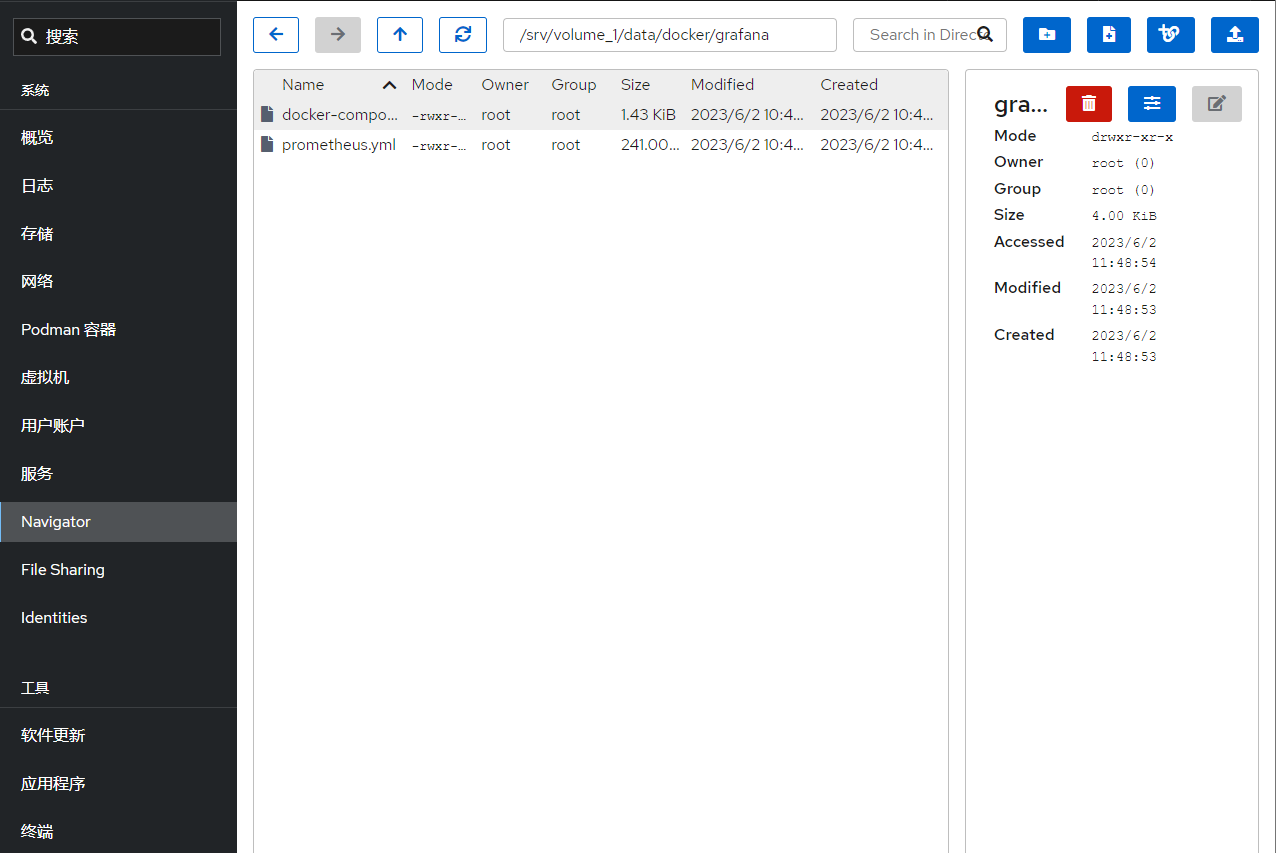
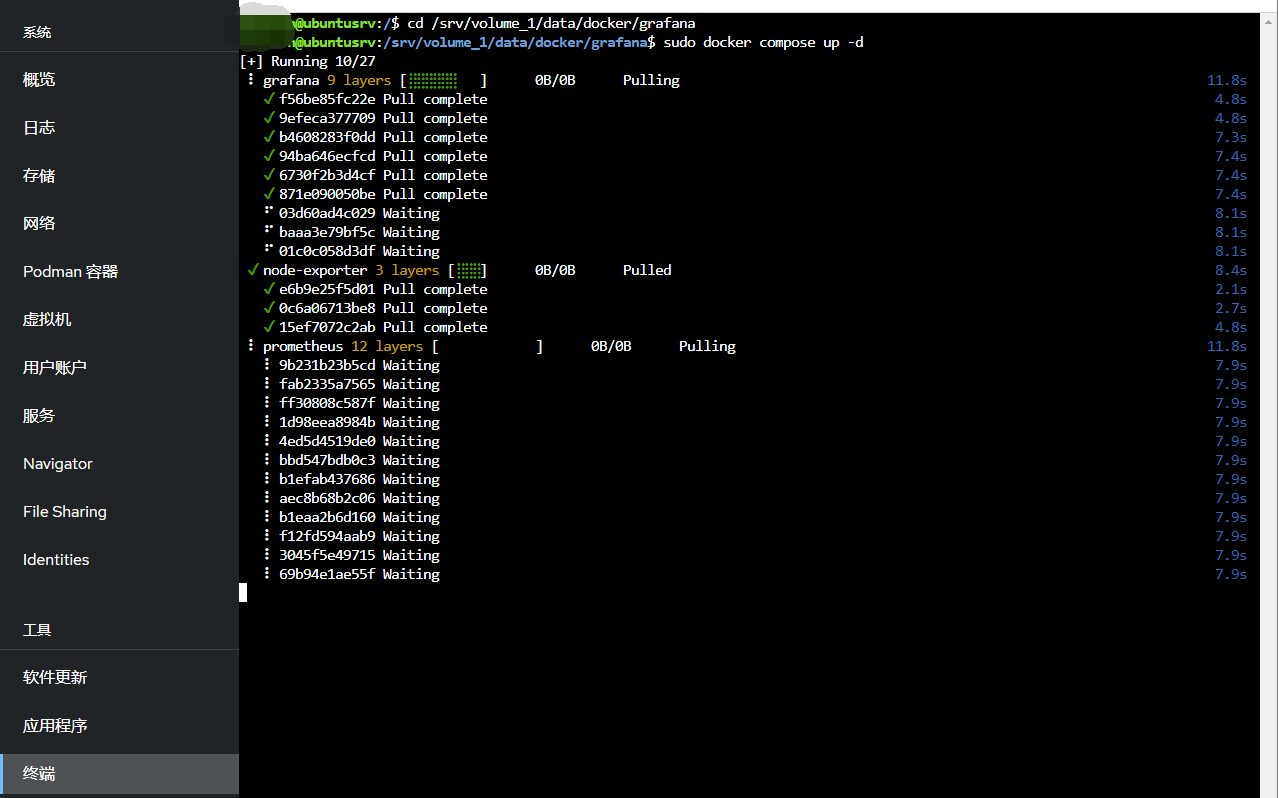
4. 启动服务
bash
cd /opt/docker/grafana
docker compose up -d
容器启动成功后,可看到所有服务处于 Up 状态。
5. 验证服务
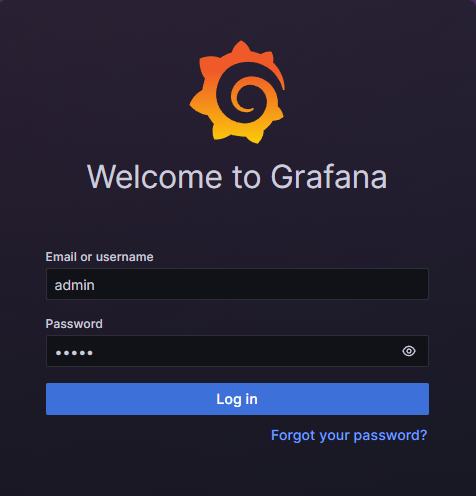
Grafana
- 地址:
http://192.168.5.10:3005 - 默认账号/密码:
admin / admin(首次登录需修改密码)
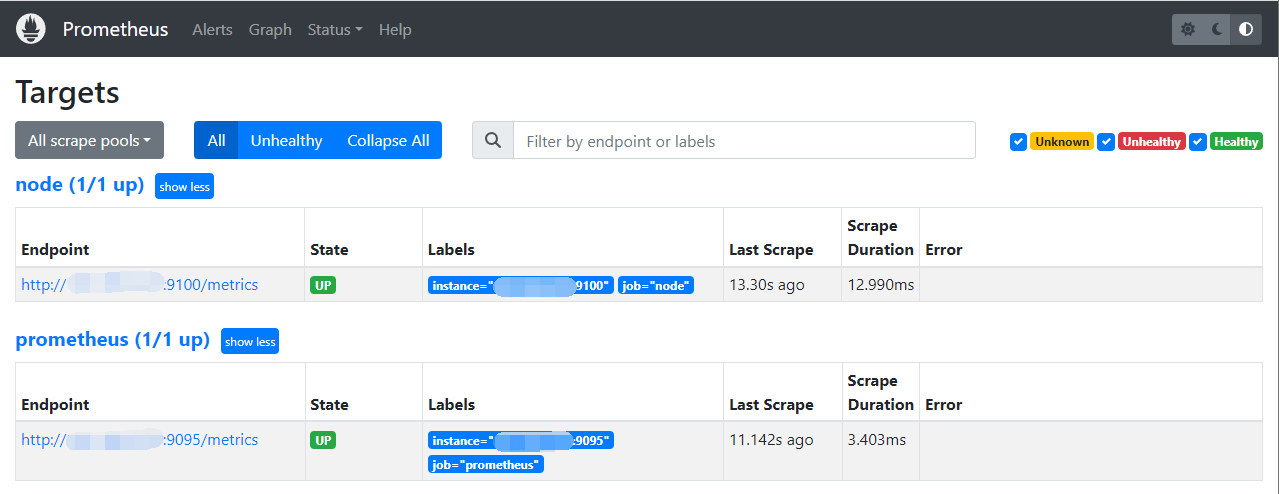
Prometheus
- 地址:
http://192.168.5.10:9095
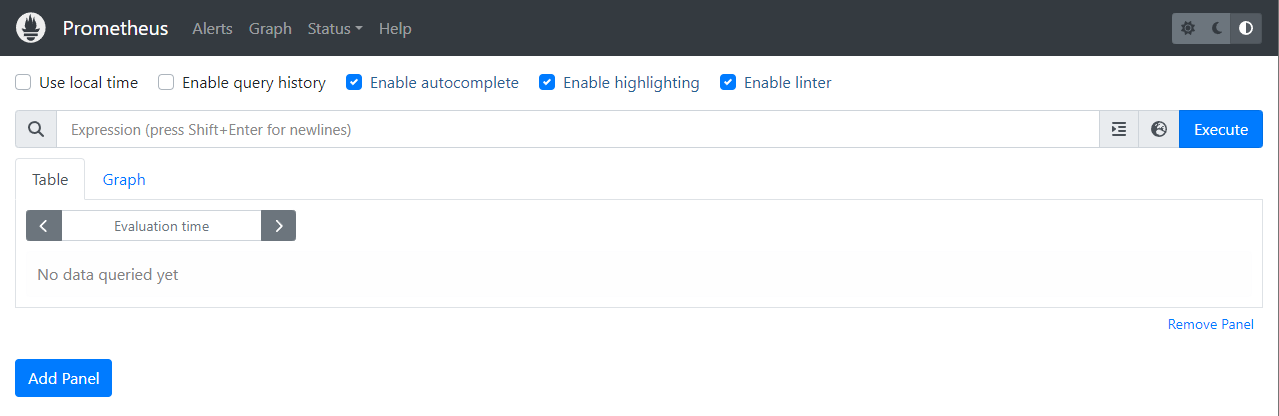
- 进入 Status → Targets 查看采集状态
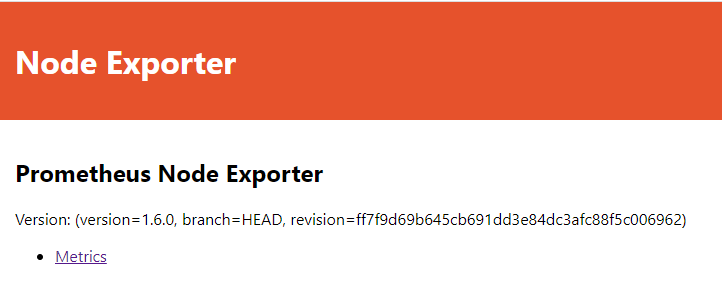
Node Exporter
- 地址:
http://192.168.5.10:9100 - 点击 Metrics 查看详细指标
6. 配置 Grafana 数据源与仪表板
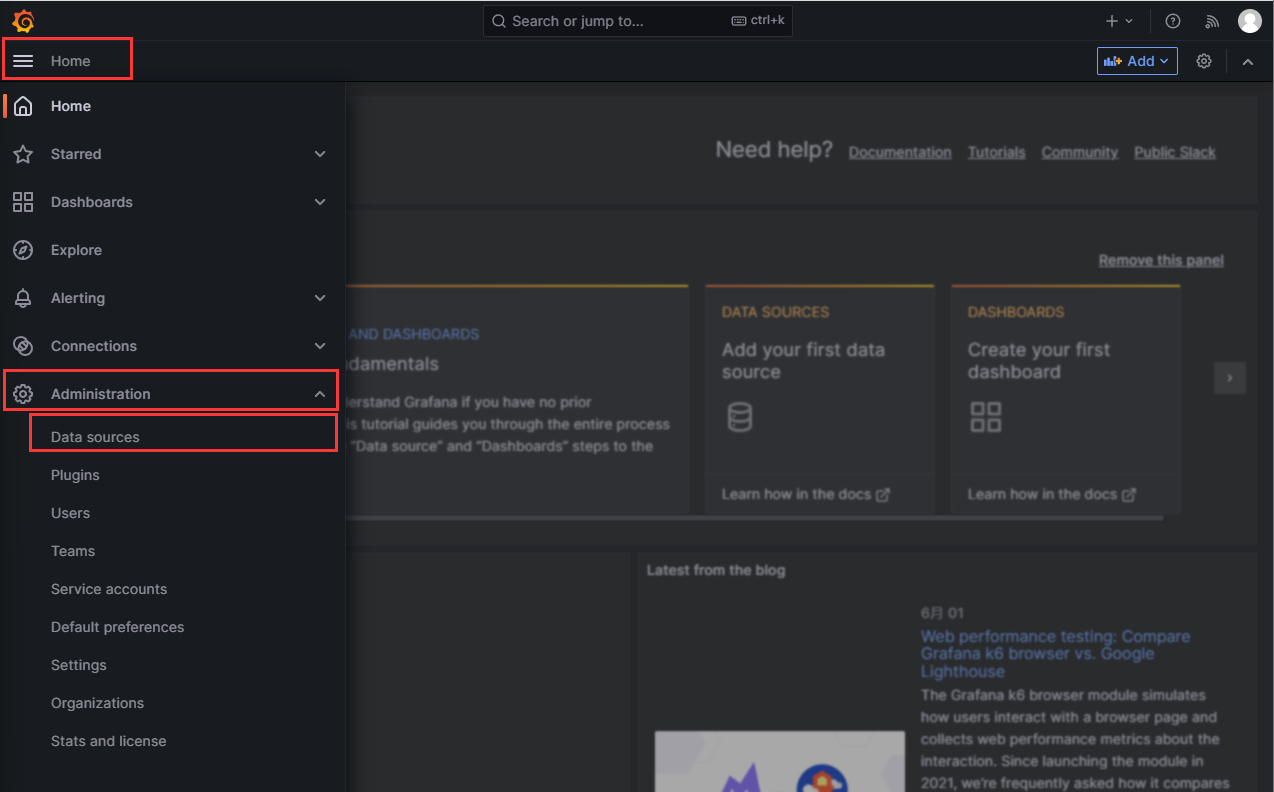
6.1 添加 Prometheus 数据源
左上角菜单 → Administration → Data sources
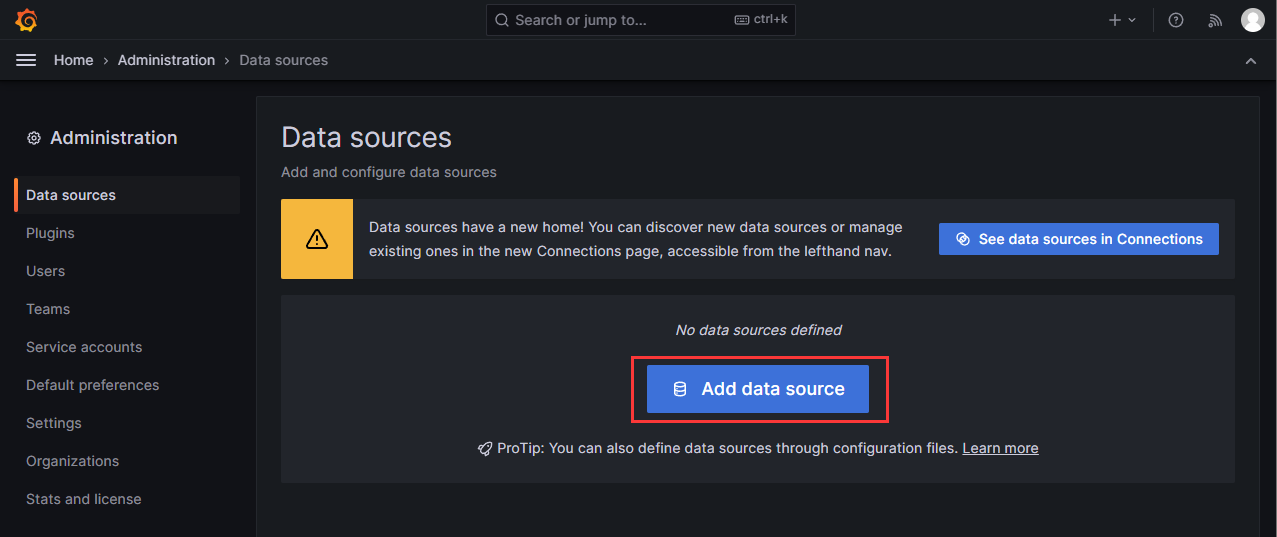
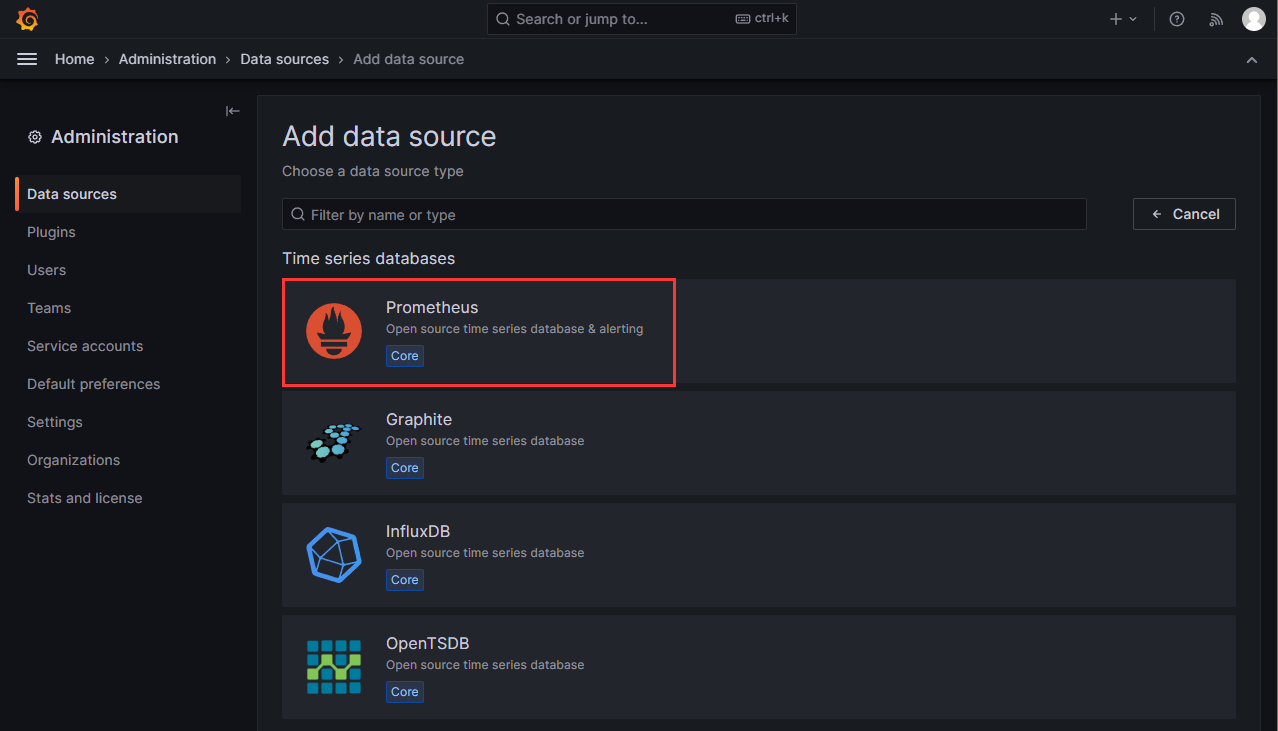
点击 Add data sources
选择 Prometheus
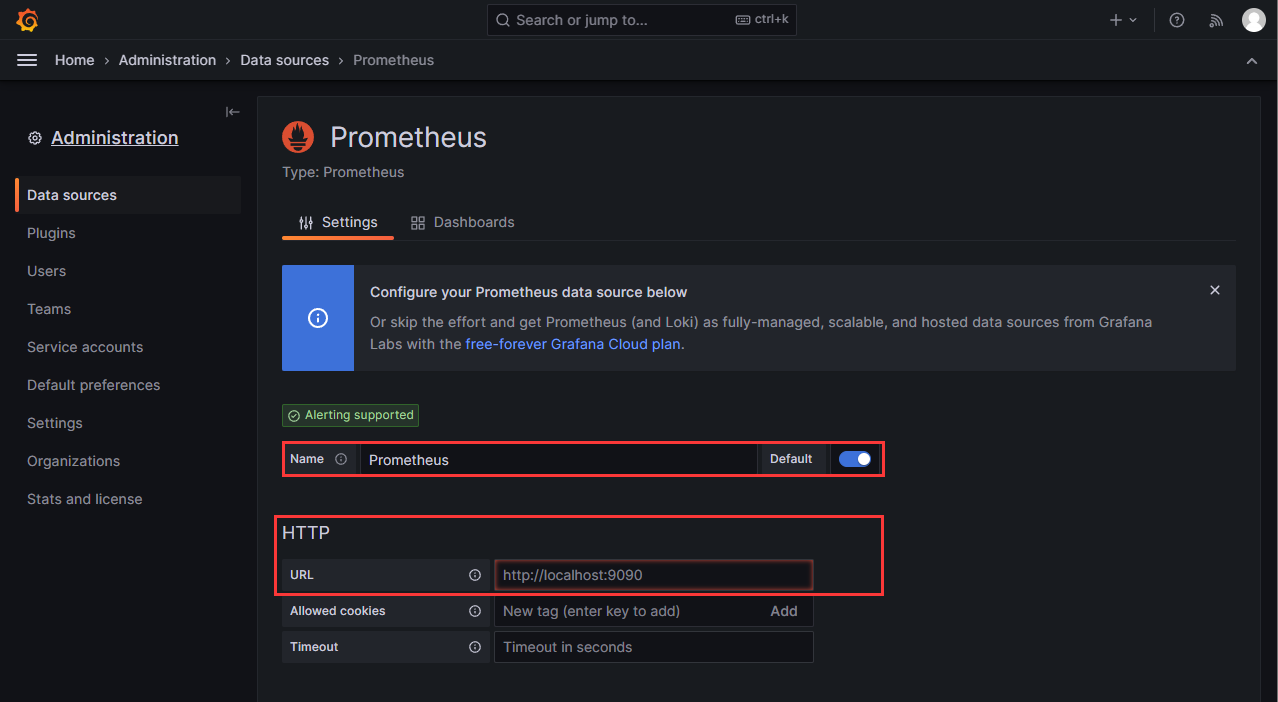
填写参数:
- Name:
Prometheus(可自定义) - URL:
http://192.168.5.10:9095
- Name:
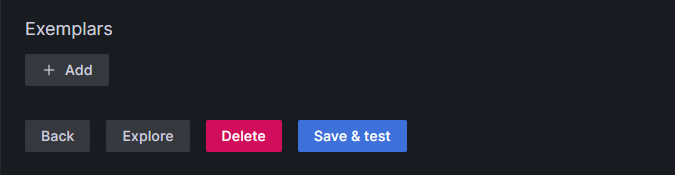
滚动到底部,点击 Save & test
6.2 导入仪表板
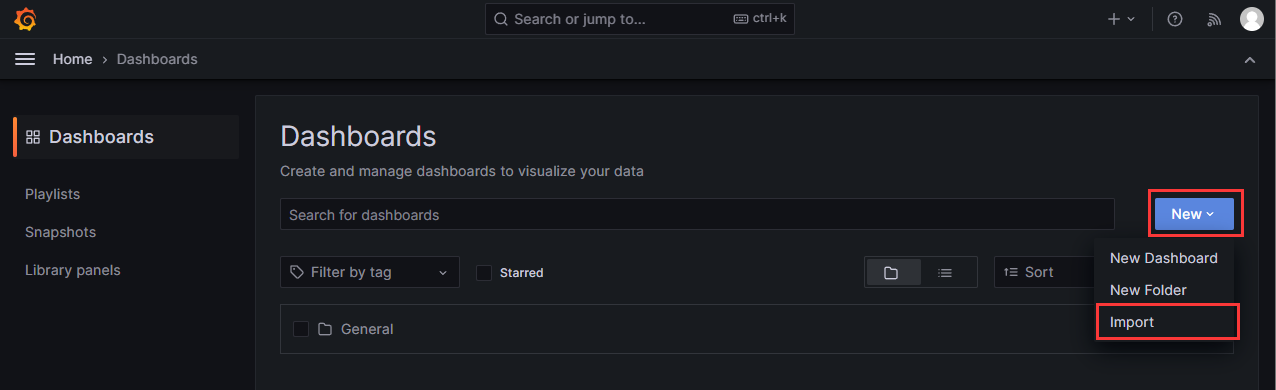
左上角菜单 → Dashboards
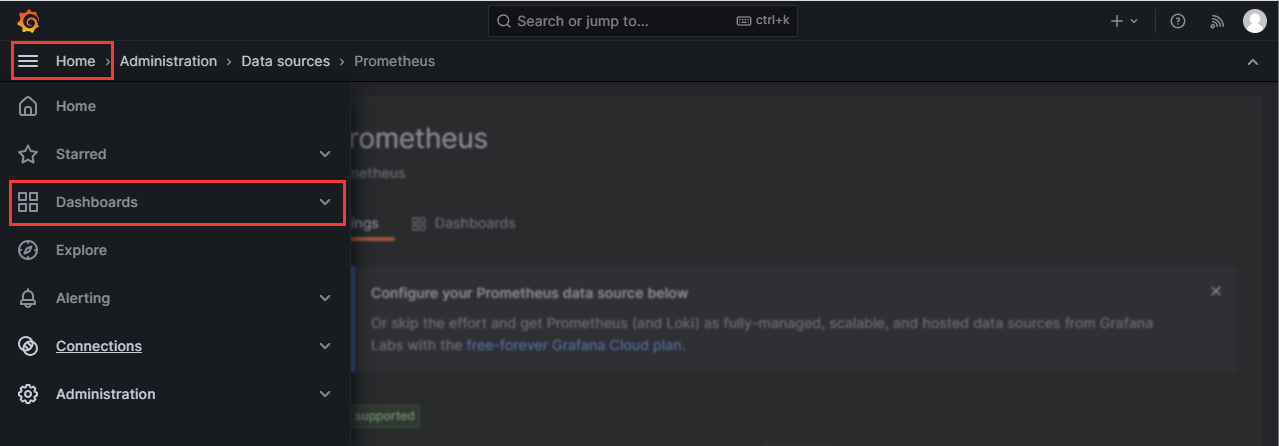
点击 New → Import
输入仪表板 ID(推荐:
12633、8919、1860),点击 Load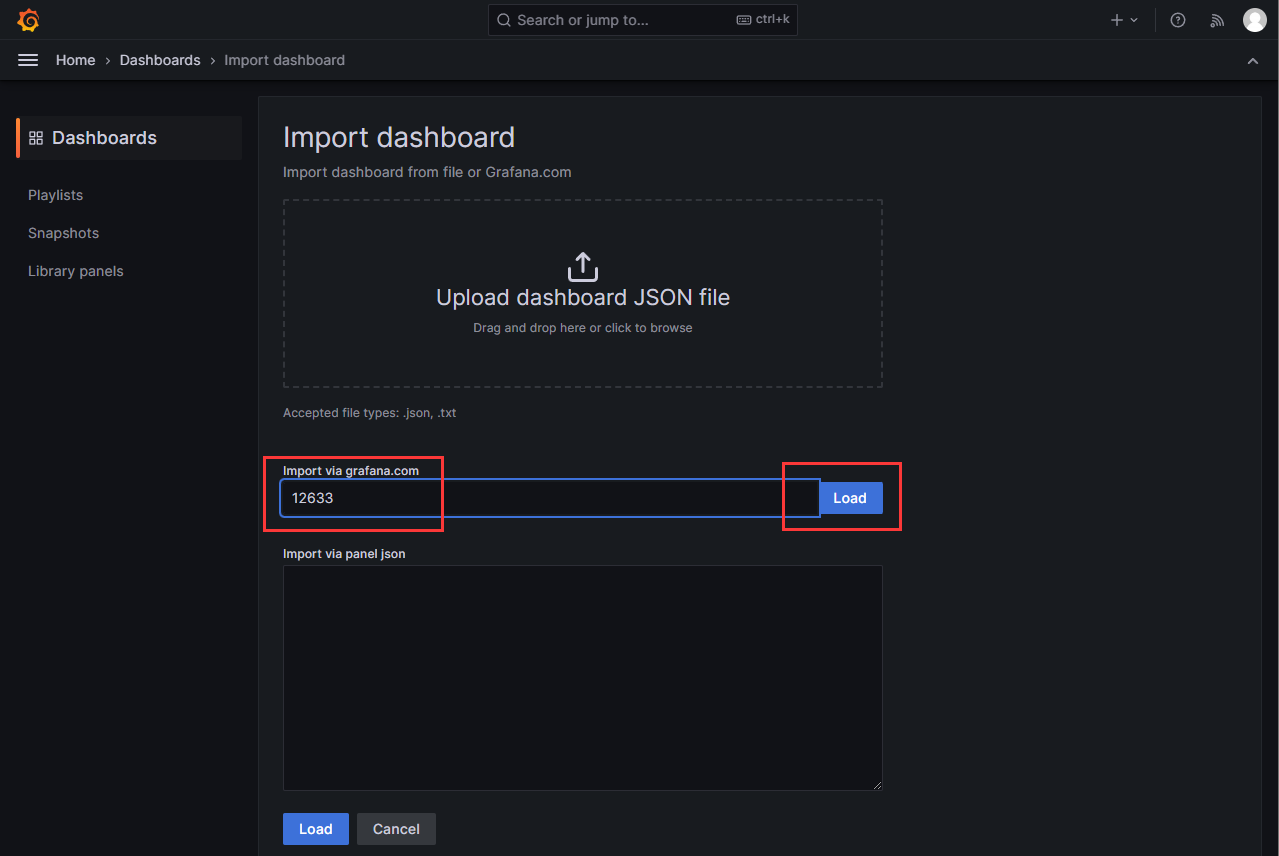
选择刚配置好的 Prometheus 数据源,点击 Import
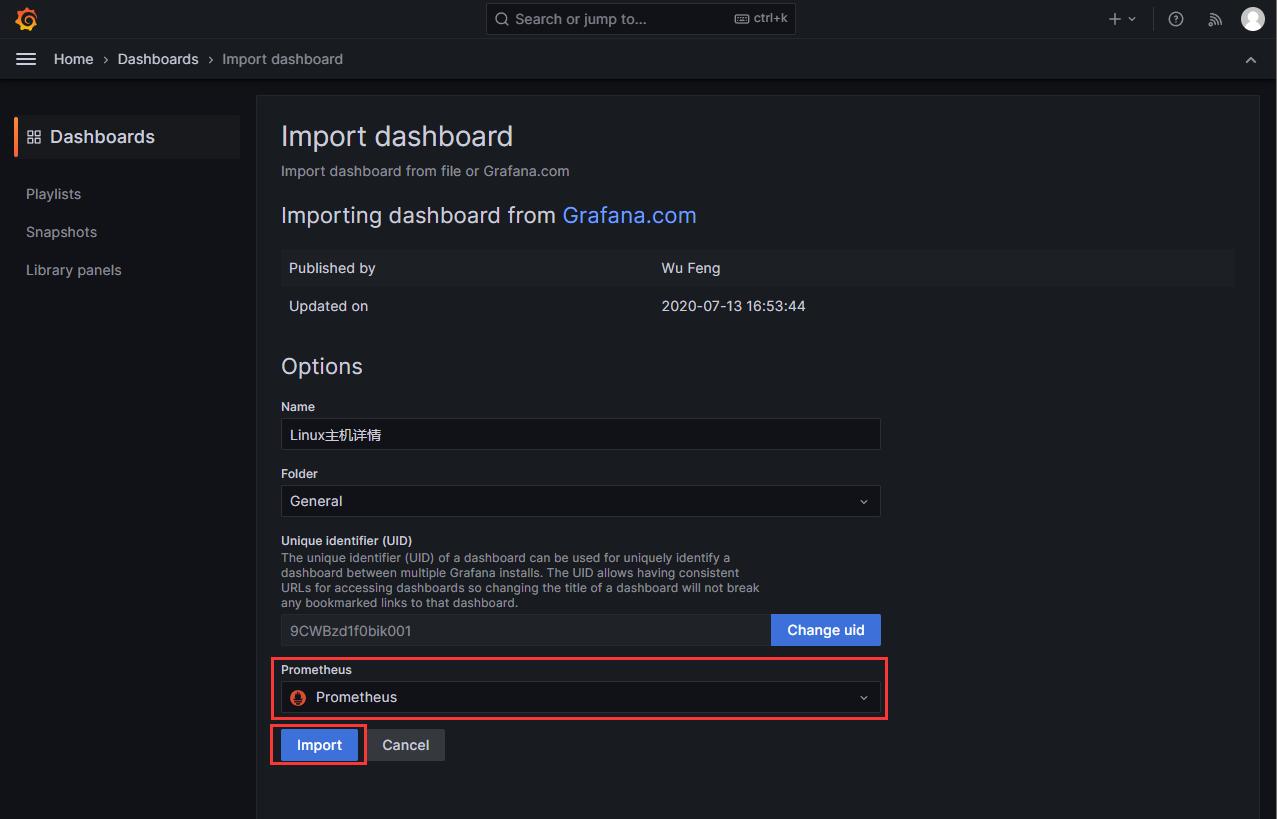
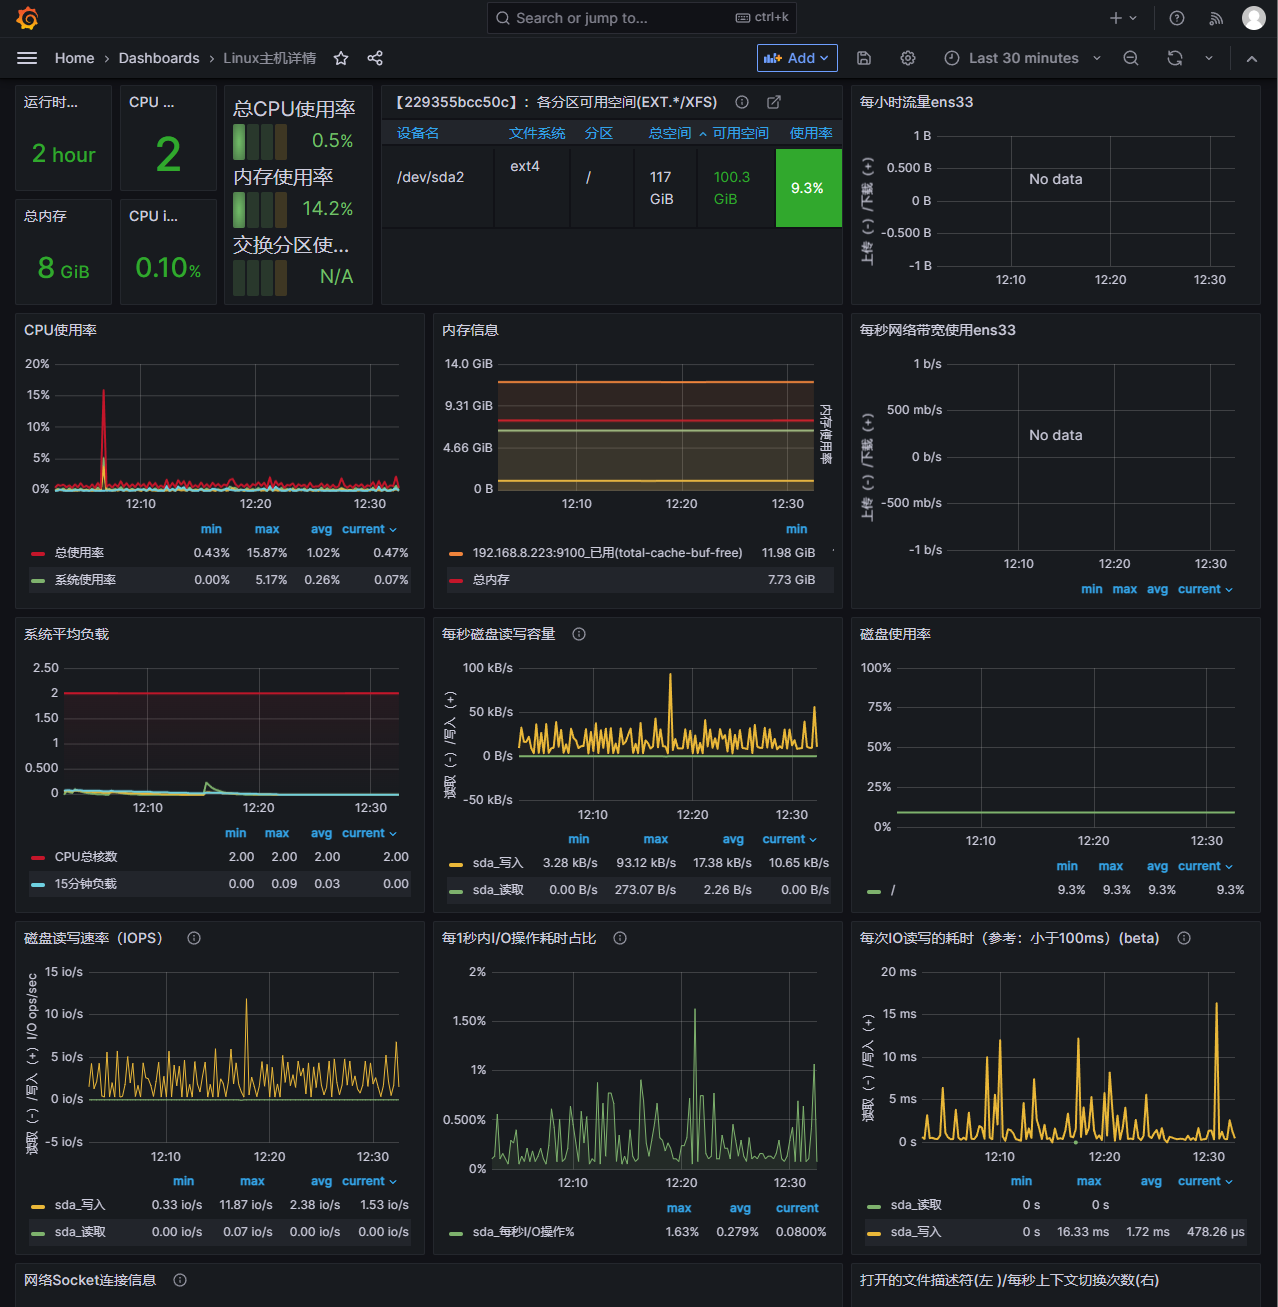
仪表板导入成功,可直接查看监控大盘
7. 常用地址汇总
- Grafana:
http://192.168.5.10:3005 - Prometheus:
http://192.168.5.10:9095 - Node Exporter:
http://192.168.5.10:9100
(请根据实际 IP 与端口替换。)